On this page
Overview
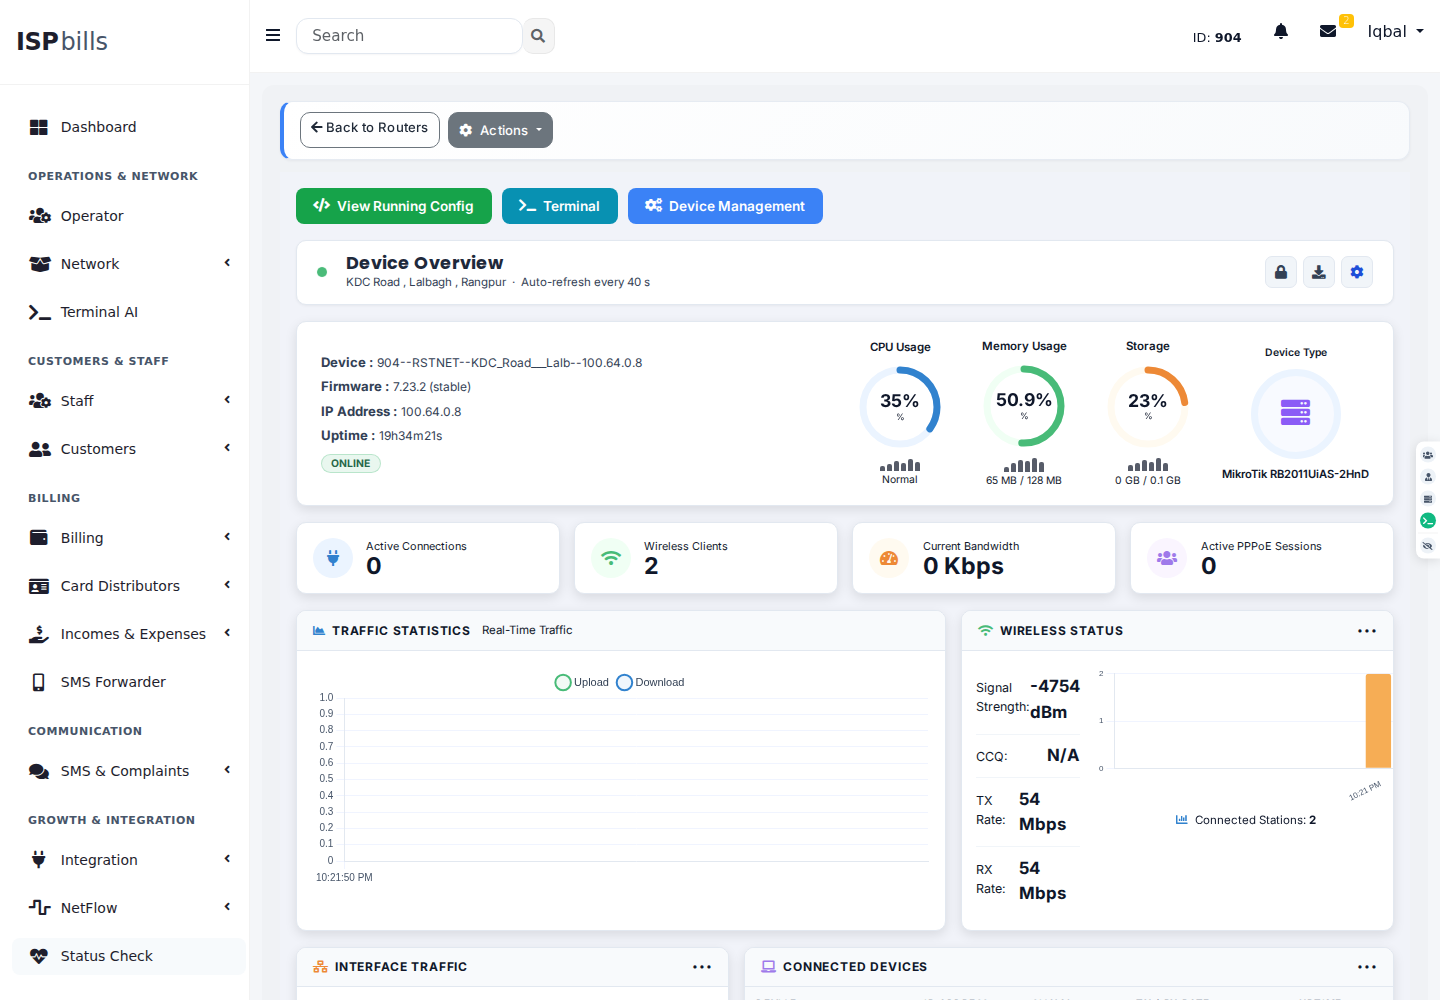
The MikroTik monitoring section provides real-time visibility into the MikroTik routers that form the backbone of your ISP network. You can view live interface traffic graphs, check router availability, inspect active PPPoE sessions, and review resource utilisation — all without leaving ISPbills.
The live monitor is responsive on phones and tablets. Resource gauges and action controls stack for touch use, charts resize to the screen, VLAN information becomes a compact multi-line row, and wide connected-device or configuration tables scroll inside their panels without moving the entire page sideways.
Prerequisites
Before a MikroTik router appears in the monitoring section, it must first be registered in Network → Router. Make sure the router’s API credentials and IP address are correctly configured there so that ISPbills can establish a connection.
Router Status
The router list shows whether each router is currently Online or Offline. An offline indicator means ISPbills could not reach the router’s API at the last polling interval, which may signal a connectivity issue or a device reboot.
PPPoE Interface Traffic Graphs
For each router, ISPbills generates RRD (Round-Robin Database) traffic graphs for PPPoE interfaces. These graphs plot inbound and outbound throughput over time, letting you identify traffic spikes, capacity saturation, or unusual usage patterns across different time ranges (hourly, daily, weekly, monthly).
Connected PPPoE Sessions
The monitoring view lists the PPPoE sessions currently active on the router, showing which customers are online at any given moment. This is useful for confirming that a customer’s connection has come up after troubleshooting, or for quickly counting the number of simultaneous sessions on a given router.
CPU and Memory Usage
Where the router’s API exposes resource data, ISPbills will display current CPU load and memory usage figures. High CPU or memory values may indicate that the router is under stress and may need attention or a capacity upgrade.
Running Interface Traffic
In addition to PPPoE-specific graphs, ISPbills shows live traffic rates for all active interfaces on the router. This gives you an instant snapshot of which interfaces are carrying load and helps isolate which segment of the network is experiencing congestion.
Device Management (Live Configuration)
Click Device Management above the live dashboard to reveal the live RouterOS configuration panels. Changes apply immediately; there is no staged apply or automatic rollback.
NOC users need the manage-router-devices permission. Their monitor routes allow creation, filter-rule enable/disable, reboot, and update operations, but do not allow deletion. The shared page can still display trash icons to NOC users; those removal requests cannot complete.
Start with MikroTik Device Management for permissions, prerequisites, audit behavior, and common errors. Then use the operation-specific guides:
- VLAN Management
- Bridge Management
- Bridge Port Management
- IP Address Management
- IP Firewall
- System Operations
Rogue DHCP Detection
From the main MikroTik live-status page (above Device Management), click Rogue DHCP to scan the router’s bridge interfaces for unauthorised DHCP servers on the LAN. You can:
- Run an on-demand scan.
- Use Rogue DHCP Setup to whitelist your legitimate DHCP servers.
- Toggle alert-on-detect so ISPbills logs an entry whenever an unknown DHCP server is seen.