On this page
Overview
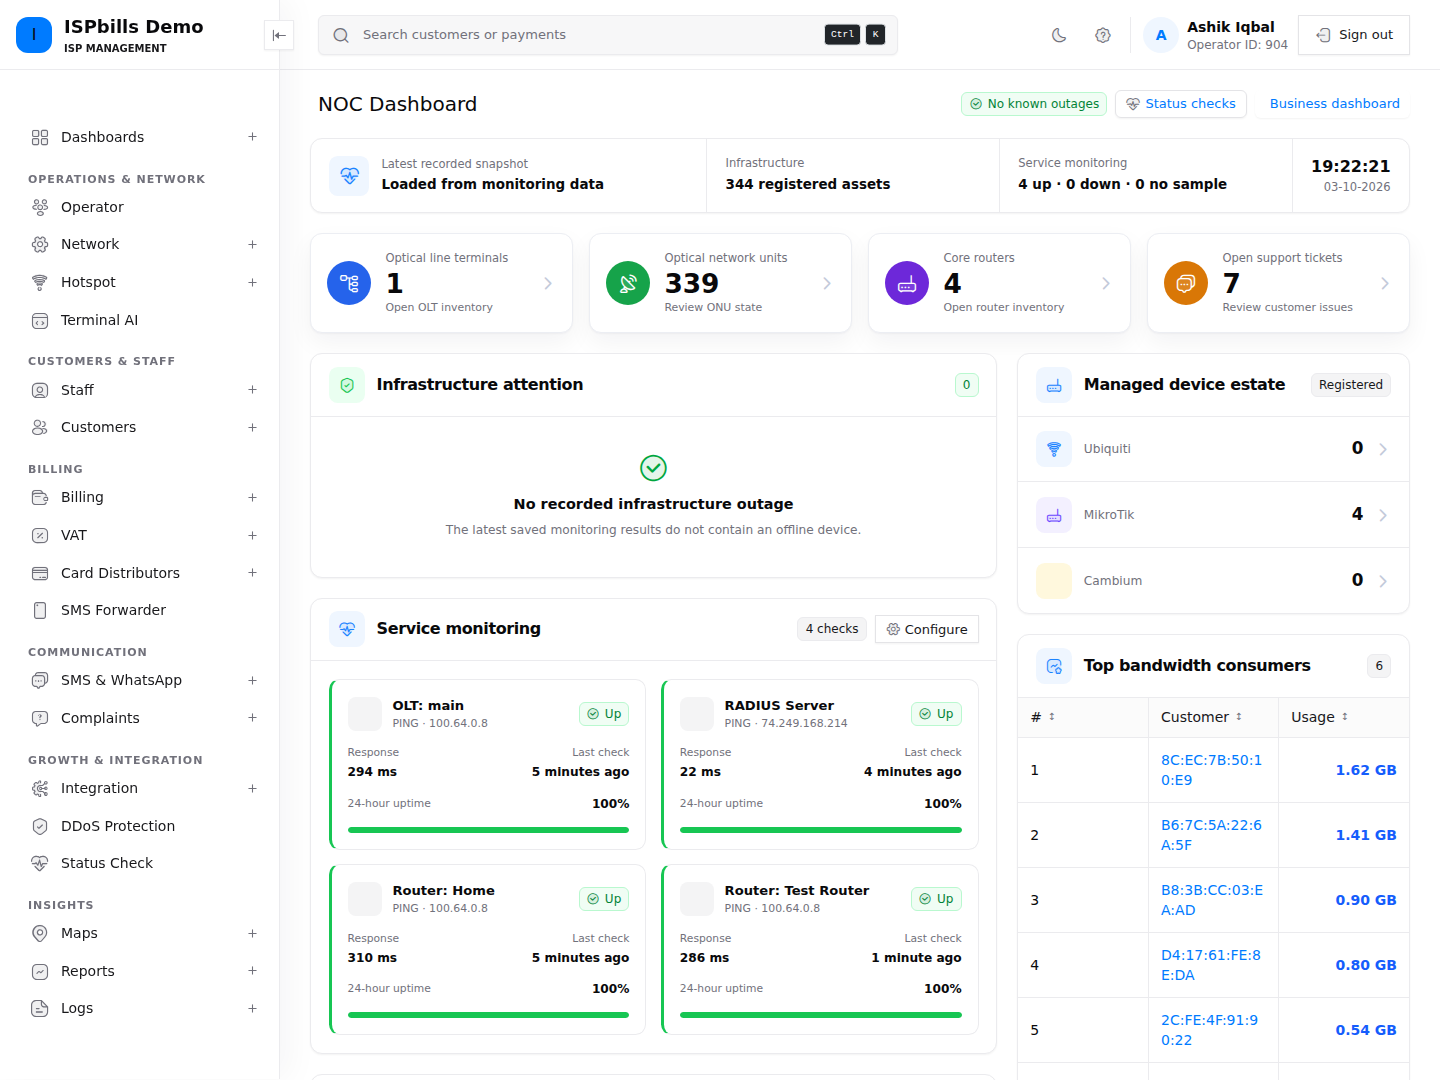
The NOC (Network Operations Center) Dashboard is the command-centre view of ISPbills — a single-pane-of-glass summary of your entire network’s health and business operations. It is designed for network operations staff who need to assess the state of the infrastructure at a glance without navigating through multiple sections of the application.
Accessing the Dashboard
Click NOC Dashboard in the left-hand sidebar to open the dashboard. It is typically set as the landing page for NOC operator roles. A live clock in the header shows the current time, and the dashboard auto-refreshes its counters and status checks every 30 seconds so the figures always reflect the current state of the network without a manual reload. The bandwidth list refreshes every 5 minutes.
Infrastructure Summary
At the top of the dashboard you will find four headline counters covering the key elements of your infrastructure:
- Total OLTs — the number of Optical Line Terminals in service.
- Total ONUs — the aggregate count of Optical Network Units (fibre customer devices) across all OLTs.
- Core Routers — the number of routers registered in ISPbills.
- Support Tickets — the count of pending (open) customer complaints.
Device Health Summary
A monitoring panel shows the number of registered devices for each supported monitoring integration, with quick links to each device list:
- Ubiquiti Devices
- Mikrotik Routers
- Cambium Devices
Offline Devices
A live panel lists every monitored device that is currently offline, with its IP, type, and when it was last checked. When everything is reachable it shows an “All monitored devices are online” confirmation. Where a device has a linked detail page, its name is clickable.
Service Monitoring
This section renders your configured status checks as widgets. Each widget shows the check’s current UP / DOWN / N/A status, latest response time, last check time, and 24-hour uptime gauge, plus the error message when a check is down. Use Configure to choose which checks appear (the selection is remembered in your browser). If no status checks exist yet, the panel links you to add them.
IP Calculator & Pool Generator
A built-in subnet calculator computes the network, broadcast, mask, wildcard, first/last host, host count, and address class/type for any IP and CIDR. The Pool Generator then splits the parent prefix into equal sub-pools (from /30 up to /24) and lists each pool’s range and usable-host count — handy for planning IP pool allocations without leaving the dashboard.
Recent Support Tickets
A table of the most recent customer complaints shows the customer, a short issue summary, how long ago it was raised, and the ticket status. Each row opens the full complaint in a new tab.
Top Bandwidth Consumers
A scrollable, ranked table of the highest-usage customers for the current period (usage shown in GB). Where a username maps to a known customer, the name links to that customer’s profile. This helps identify unusually heavy users and informs capacity planning.
IP Pool Utilization
Per-pool usage bars show each IP pool’s name, subnet, and percentage in use, colour-coded green/amber/red as utilisation climbs, so you can spot pools nearing exhaustion.
Signal Watch
A monitor listing ONUs with critical optical signal levels. Each entry shows the ONU identifier, its OLT and port, and the measured signal in dBm, flagged as LOS, Too Low, High Power, or Too High as appropriate. A signal-health guide at the bottom explains the healthy range (roughly -8 to -24 dBm) versus saturation and loss-of-signal thresholds.