Dashboard
Overview of the ISPbills dashboard — key metrics, charts, and quick links
Overview of the ISPbills dashboard — key metrics, charts, and quick links
On this page
The dashboard is your operational command centre. As soon as you log in, it shows a real-time snapshot of your financials, customer status, and network activity so you can spot issues at a glance and take action immediately.
Every role in ISPbills has its own tailored dashboard. This page describes the widgets and charts available on the Group Admin dashboard (the most comprehensive view) and then highlights what differs for operators, sub-operators, managers, and the NOC dashboard.
The dashboard updates automatically. All figures reflect your own account scope; reseller and sub-operator totals are shown separately where applicable.
Overview
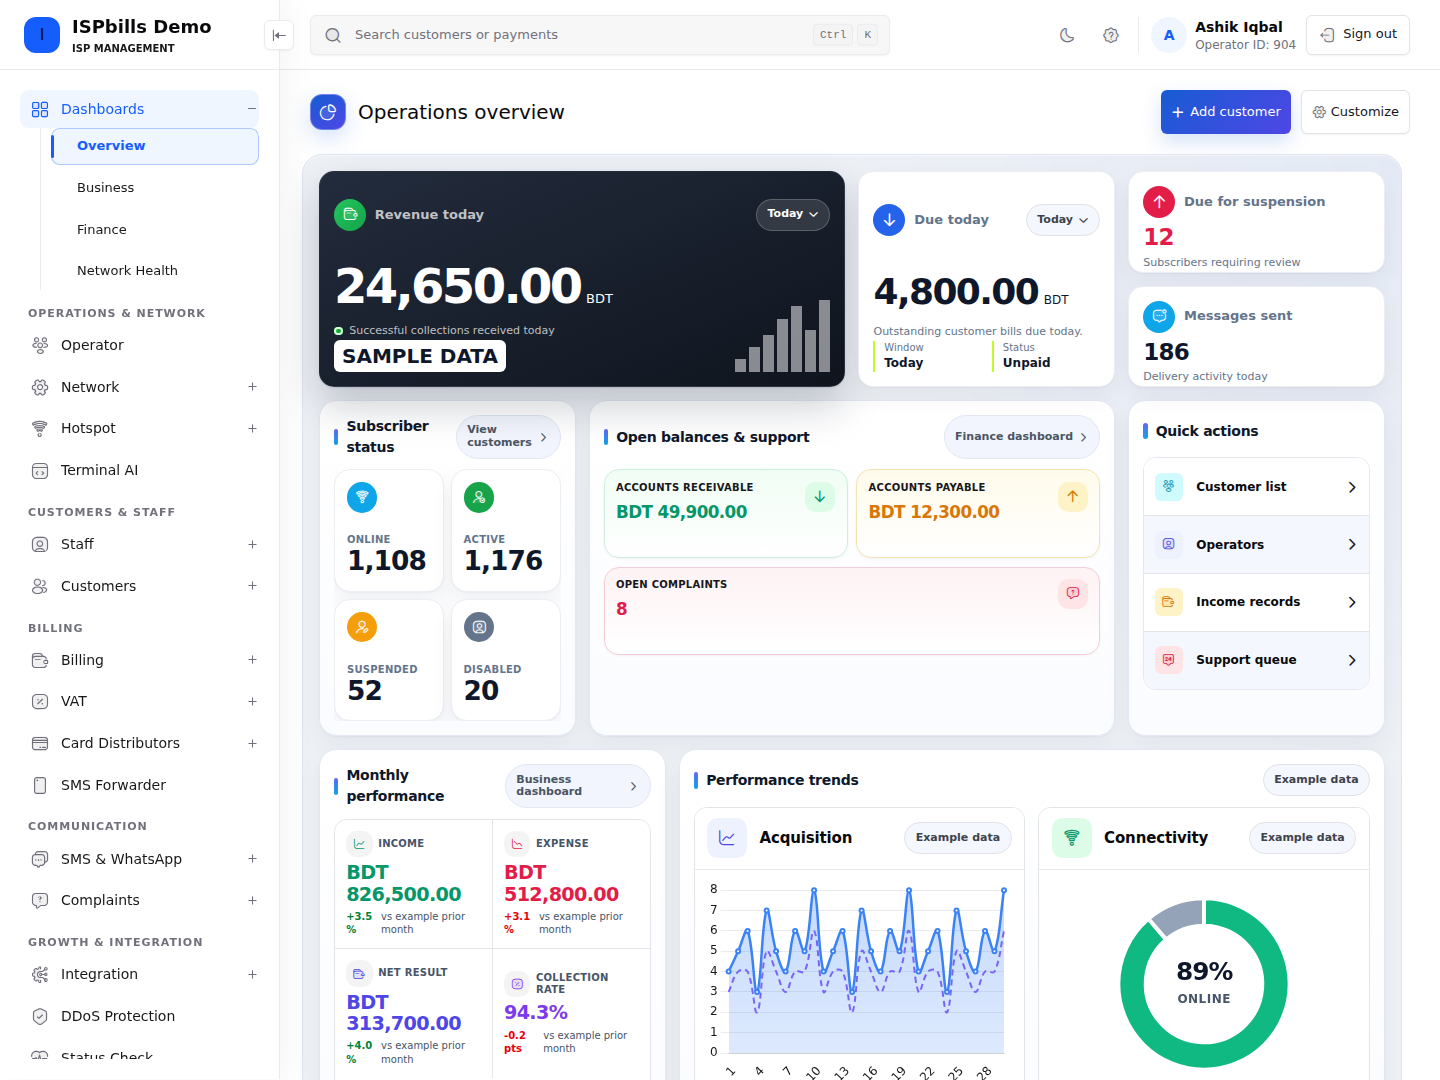
The Group Admin dashboard is titled Operations overview and is organised into stacked sections you scroll through top to bottom:
- Today at a glance — the day’s priority metrics (revenue, dues, suspensions, messaging).
- Subscriber status — colour-coded counters for your customer base.
- Open balances & support — accounts receivable, accounts payable, and open complaints.
- Quick actions — one-click shortcut cards to common pages.
- Monthly performance — income, expense, net result, and collection rate with month-over-month change.
- Performance trends and Finance insights — subscriber and cash-flow charts.
- Access network — router, OLT, and ONU availability plus optical-signal risk.
Together these sections give you a complete picture of your business without leaving a single page. Every metric tile links to the detailed page behind it, and the “Today at a glance” figures load live after the page opens.
Customize the Group Admin dashboard
Select Customize on the Group Admin dashboard to open the customization workspace. Your live dashboard remains unchanged until you apply the preview.
You can:
- drag widgets into a preferred order — and move them between sections (Today at a glance, Subscriber status, Open balances & support, Quick actions, Performance trends, Access network);
- set each widget’s width (from a quarter up to full width);
- choose a separate accent colour for each widget;
- apply one accent colour to a whole section;
- use the ready Dodger Blue, Pumpkin Orange, Medium Sea Green, Charcoal Gray, and Emerald Green presets or pick a custom colour;
- clear a section accent, or reset all dashboard preferences; and
- preview responsive desktop and mobile sizing before saving.
Layout and colour preferences are stored for the signed-in Group Admin and retain the original widget content and links.
Widgets remain full width within their grid cell and automatically reflow for tablets and phones. Reordering does not change dashboard calculations or permissions.
Today at a glance
The first section shows four priority cards for the current day. Their values load live shortly after the page opens, and each card links to the matching list.
| Card | What it means | Opens |
|---|---|---|
| Revenue today | Successful collections received today | Today’s payment records |
| Due today | Outstanding customer bills due today | Today’s due bills |
| Due for suspension | Subscribers requiring review that are due for suspension today | Customer list filtered to those due for suspension |
| Messages sent | Message-delivery activity today | SMS history |
Use the Due for suspension count to proactively contact at-risk customers or issue reminders before service is interrupted.
Subscriber status
Four colour-coded counters summarise your customer base. Each tile is clickable and opens the matching customer list.
| Tile | Description | Opens |
|---|---|---|
| Online | Subscribers connected and authenticated on the network right now | Online customers |
| Active | Subscribers with an active service plan | Customers filtered to active |
| Suspended | Subscribers whose service is currently suspended | Customers filtered to suspended |
| Disabled | Subscribers who have been disabled | Customers filtered to disabled |
Keep an eye on the Suspended count and the Due for suspension card above — a rising number may indicate billing-cycle issues or payment-gateway problems.
Open balances & support
This section pairs your two account balances with the support backlog. A link at the top-right jumps to the full Finance dashboard.
| Tile | What it means | Opens |
|---|---|---|
| Accounts receivable | Total amount owed to you | Accounts receivable report |
| Accounts payable | Total advance balance you hold | Accounts payable report |
| Open complaints | Count of complaints still in the open state | Complaints list |
The Open complaints tile turns red when there is at least one open complaint, so a backlog stands out immediately.
Quick actions
Four shortcut cards jump straight to the pages you use most:
| Card | Where it takes you |
|---|---|
| Customer list | Full customer list |
| Operators | Operator management |
| Income records | Operator income records |
| Support queue | Complaints list |
Monthly performance
A four-tile panel compares this month against the previous full month. Each tile shows the current value and the percentage (or points) change versus the previous month; when there is no prior-month baseline it says so.
| Tile | What it shows |
|---|---|
| Income | Income recorded this month |
| Expense | Expenses recorded this month |
| Net result | Income minus expense (shown red when negative) |
| Collection rate | Percentage of billed amounts collected |
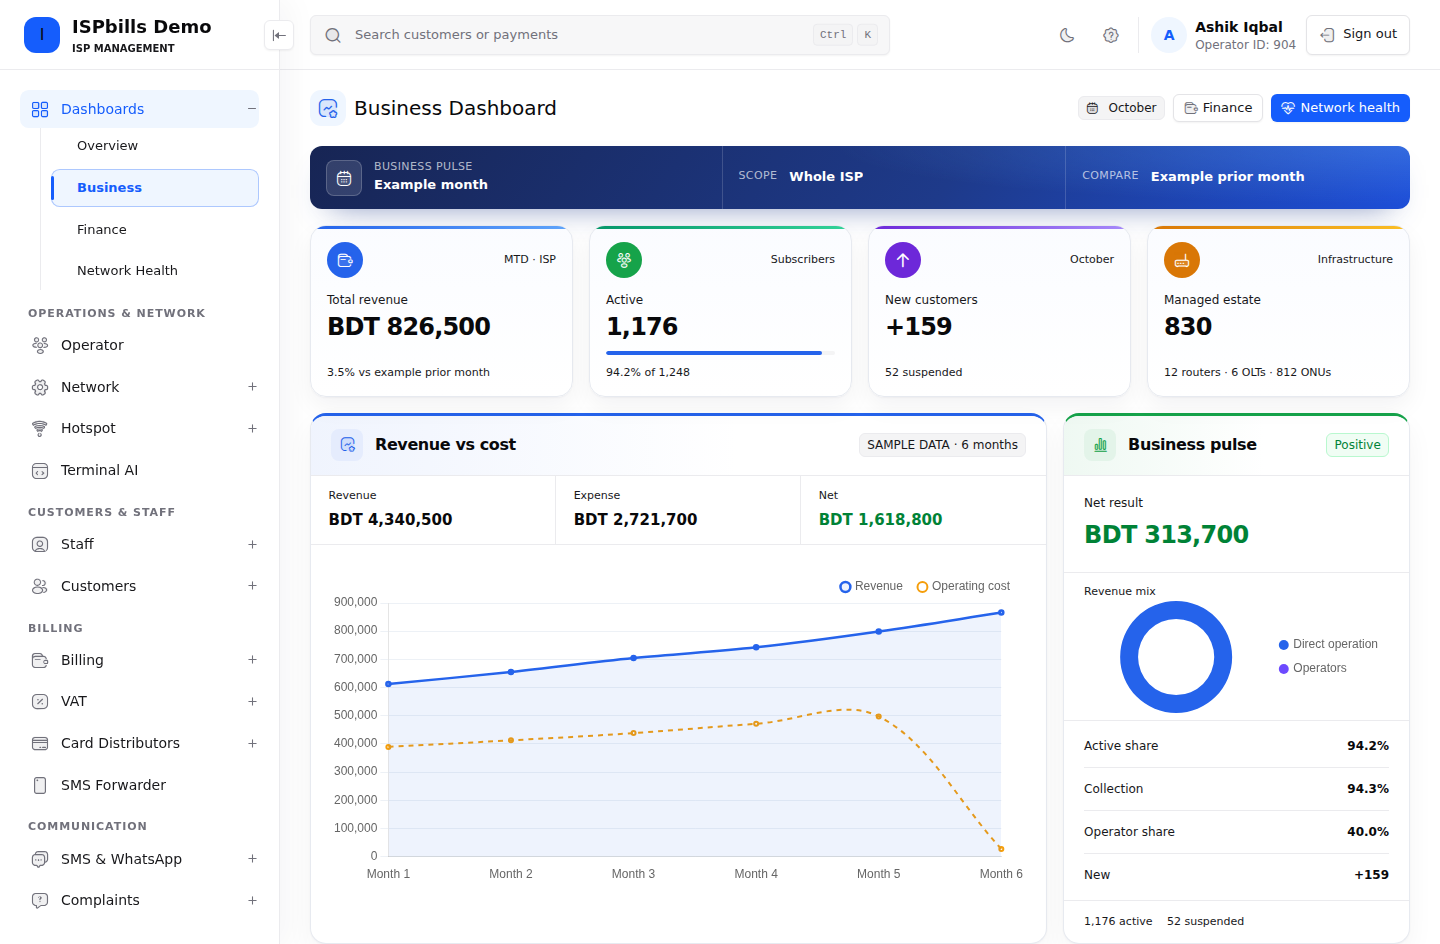
A link at the top-right opens the fuller Business dashboard.
Performance trends
Two interactive charts sit under Performance trends:
Acquisition
A daily new-subscriber trend for the current month overlaid against the previous month, so you can compare acquisition pace week by week.
Connectivity
A donut chart of the latest subscriber connectivity snapshot — Online versus Offline — with the online rate shown in the centre.
Finance insights
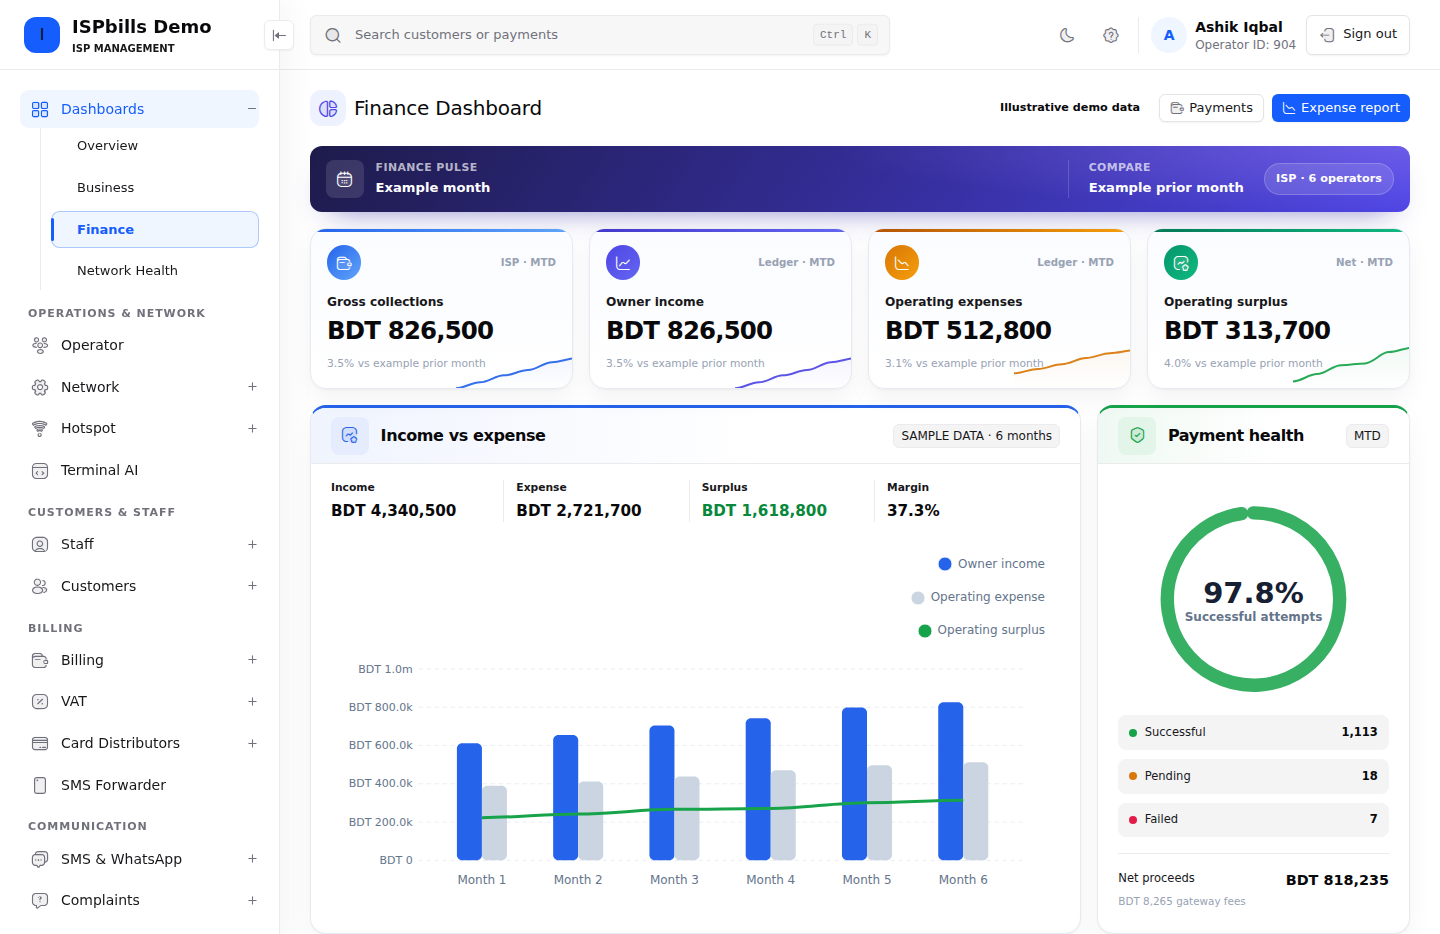
The Finance insights panel holds two six-month charts:
Income vs expense
A six-month cash-flow trend comparing income against expenses.
Billing vs collections
A six-month trend comparing amounts billed against amounts collected — a widening gap signals collection problems.
A link at the top-right opens the full Finance dashboard.
Access network
The final section, Access network health, summarises the availability and optical-signal risk of your infrastructure. If no access-network devices are connected yet, it shows a setup prompt instead.
| Metric | What it shows |
|---|---|
| Routers online | Online routers out of the total, with the offline count |
| OLTs online | Online OLTs out of the total, with the offline count |
| ONUs online | Online ONUs out of the total, with the offline count |
| Low optical signal | ONUs whose optical signal needs review |
An availability chart accompanies the summary, and a link at the top-right opens the full Network dashboard.
Tip: Click any chart or card to navigate directly to the detailed page behind it.
Role-specific dashboards
ISPbills shows a different dashboard depending on your role. The sections above describe the Group Admin view, which is the most complete. Other roles see a subset tailored to their responsibilities.
Group Admin dashboard
The Group Admin (ISP owner) Operations overview dashboard includes every section described on this page:
- Today at a glance (revenue today, due today, due for suspension, messages sent)
- Subscriber status tiles (online, active, suspended, disabled)
- Open balances & support (receivable, payable, open complaints)
- Quick actions and Monthly performance
- Performance trends, Finance insights, and Access network charts
- A customizable layout (drag, resize, recolour widgets and sections)
Group Admins also have sibling dashboards linked from this page and the sidebar: the Business dashboard, Finance dashboard, and Network dashboard, each focused on a deeper slice of revenue, finance, or network metrics.
NOC dashboard
The NOC Dashboard (Network Operations Centre) is purpose-built for network teams. Instead of financial widgets it focuses on:
- Infrastructure counters — total OLTs, ONUs, core routers, and open support tickets
- Device health summary — registered Ubiquiti, Mikrotik, and Cambium device counts
- Offline devices — a live list of monitored devices that are currently down
- Service monitoring — up/down status, response time, and 24-hour uptime for your configured status checks
- Top bandwidth consumers, IP pool utilization, and a Signal Watch list of ONUs with critical optical signal
- A built-in IP calculator & pool generator
The dashboard auto-refreshes its counters and status checks every 30 seconds. See the dedicated NOC Dashboard page for full details.
Access the NOC Dashboard from the sidebar, or directly within the NOC Panel for NOC users. For information on creating and managing NOC users, see NOC Role.
Operator dashboard
Operators see a dashboard scoped to their own customer base:
- Customer status tiles (active, suspended, billed, online)
- Today’s collection and due amounts
- Charts for their own subscribers only
- Quick links to customer management, billing, and SMS
Operators do not see group-wide accounting figures or other operators’ data.
Sub-Operator dashboard
Sub-Operators receive a simplified view similar to the Operator dashboard, limited to the customers assigned to them. Financial summaries and reseller breakdowns are not shown.
Manager dashboard
Managers see a permission-controlled dashboard. The widgets displayed depend on the specific permissions granted by their parent operator — for example, a manager with the receive-payment permission will see collection totals, while one without it will not. The dashboard adapts automatically based on assigned permissions.
Sales Manager dashboard
The Sales Manager dashboard focuses on lead tracking and operator onboarding. It shows self-registered admin counts, sales comment activity, and SMS status rather than financial or network widgets.
Tips for getting the most out of your dashboard
- Start each day here. The dashboard gives you a 30-second health check of your business.
- Watch the “Due for suspension” card. Proactively reaching out to at-risk customers reduces churn.
- Use the Connectivity chart and Access network health to spot outages affecting a specific segment or device.
- Compare Billing vs collections monthly to catch collection trends before they become problems.
- Bookmark the NOC Dashboard if you manage network infrastructure — it is optimised for operational monitoring.
Related pages:
- Billing — detailed billing and invoice management
- Accounting — financial reports, journal, and ledger
- Monitoring — network device monitoring and status checks
- Customer Management — subscriber lifecycle management